Observability
Monitoring with Grafana
Out of the box, you get monitoring via Prometheus and Grafana.
| You may want to push some load onto the deployed applications in order to see some metrics. |
Run the following command to produce load.
./scripts/run.shkubectl -n istio-system port-forward $(kubectl -n istio-system get pod -l app=grafana -o jsonpath='{.items[0].metadata.name}') 3000:3000 &
open http://localhost:3000/d/_GZa3UHWk/istio-mesh-dashboard?orgId=1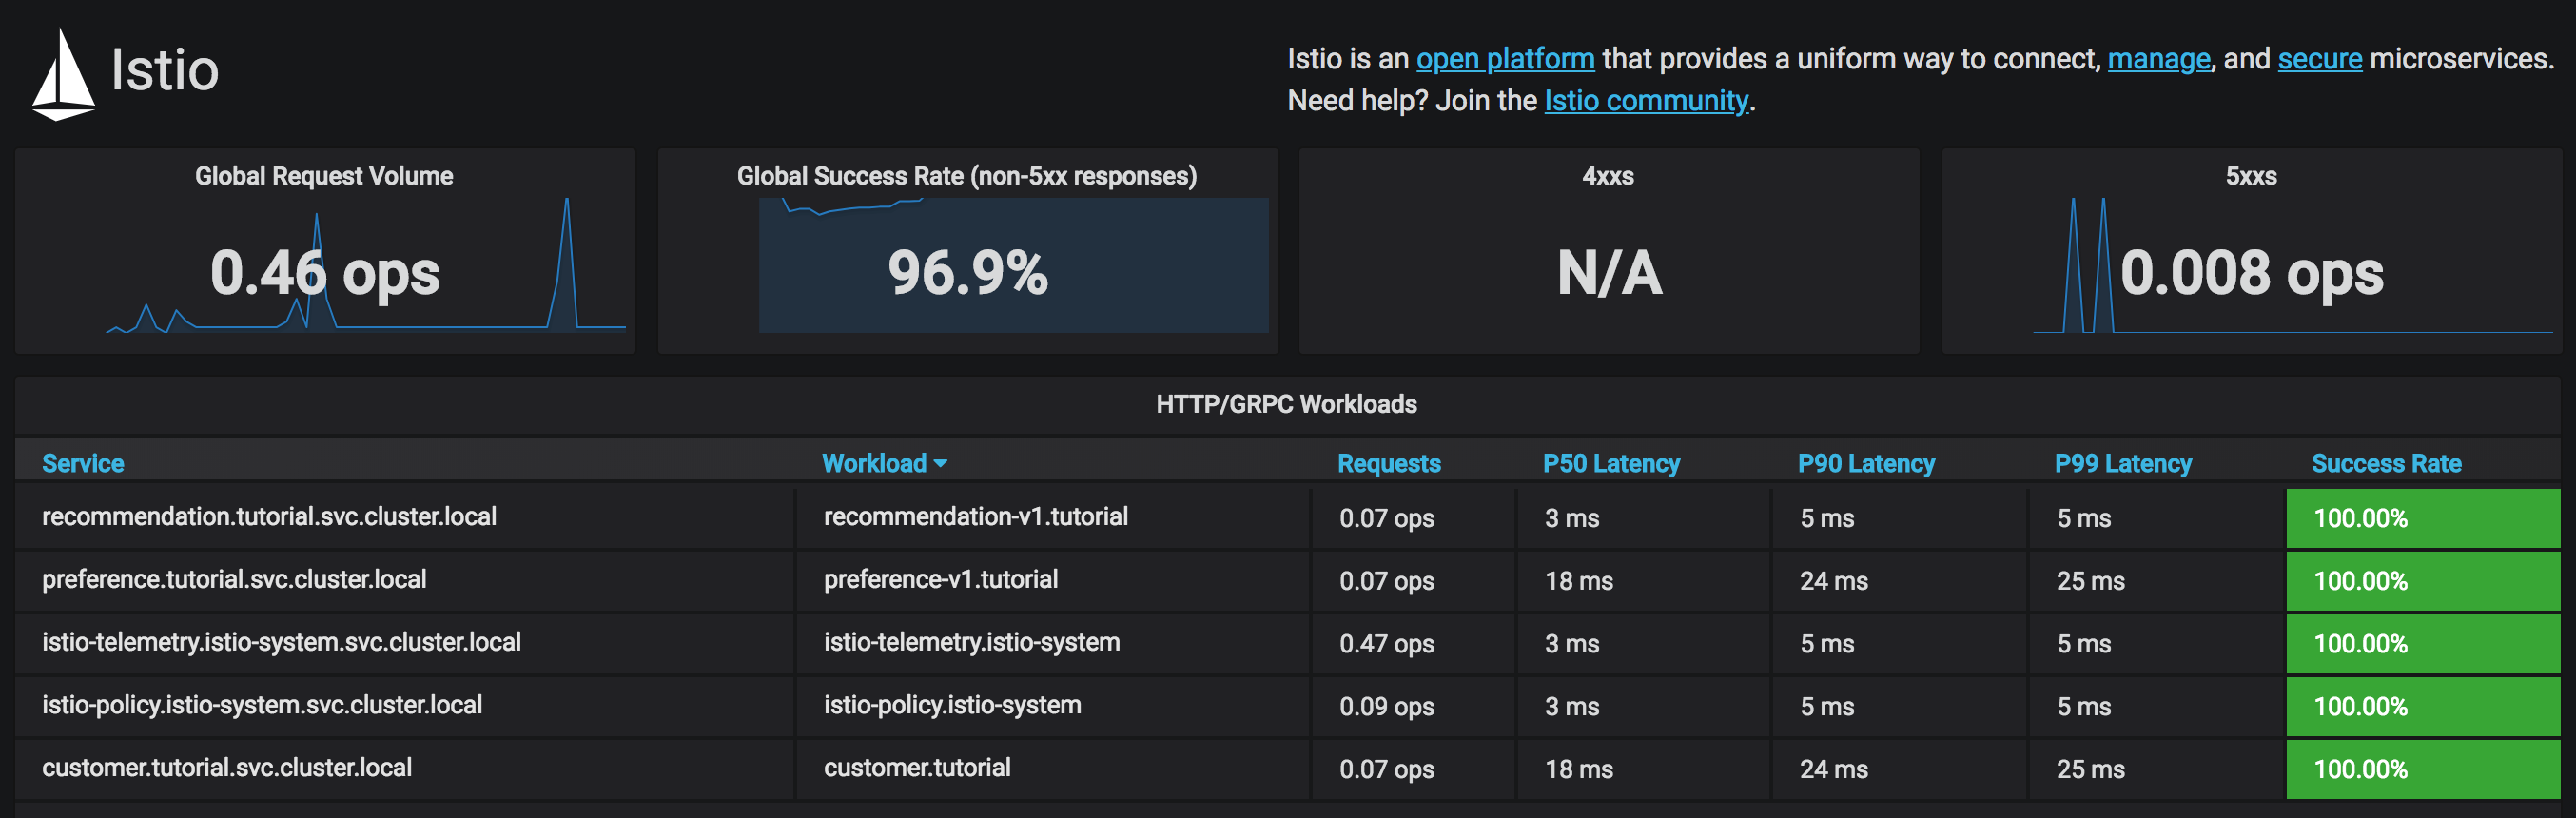
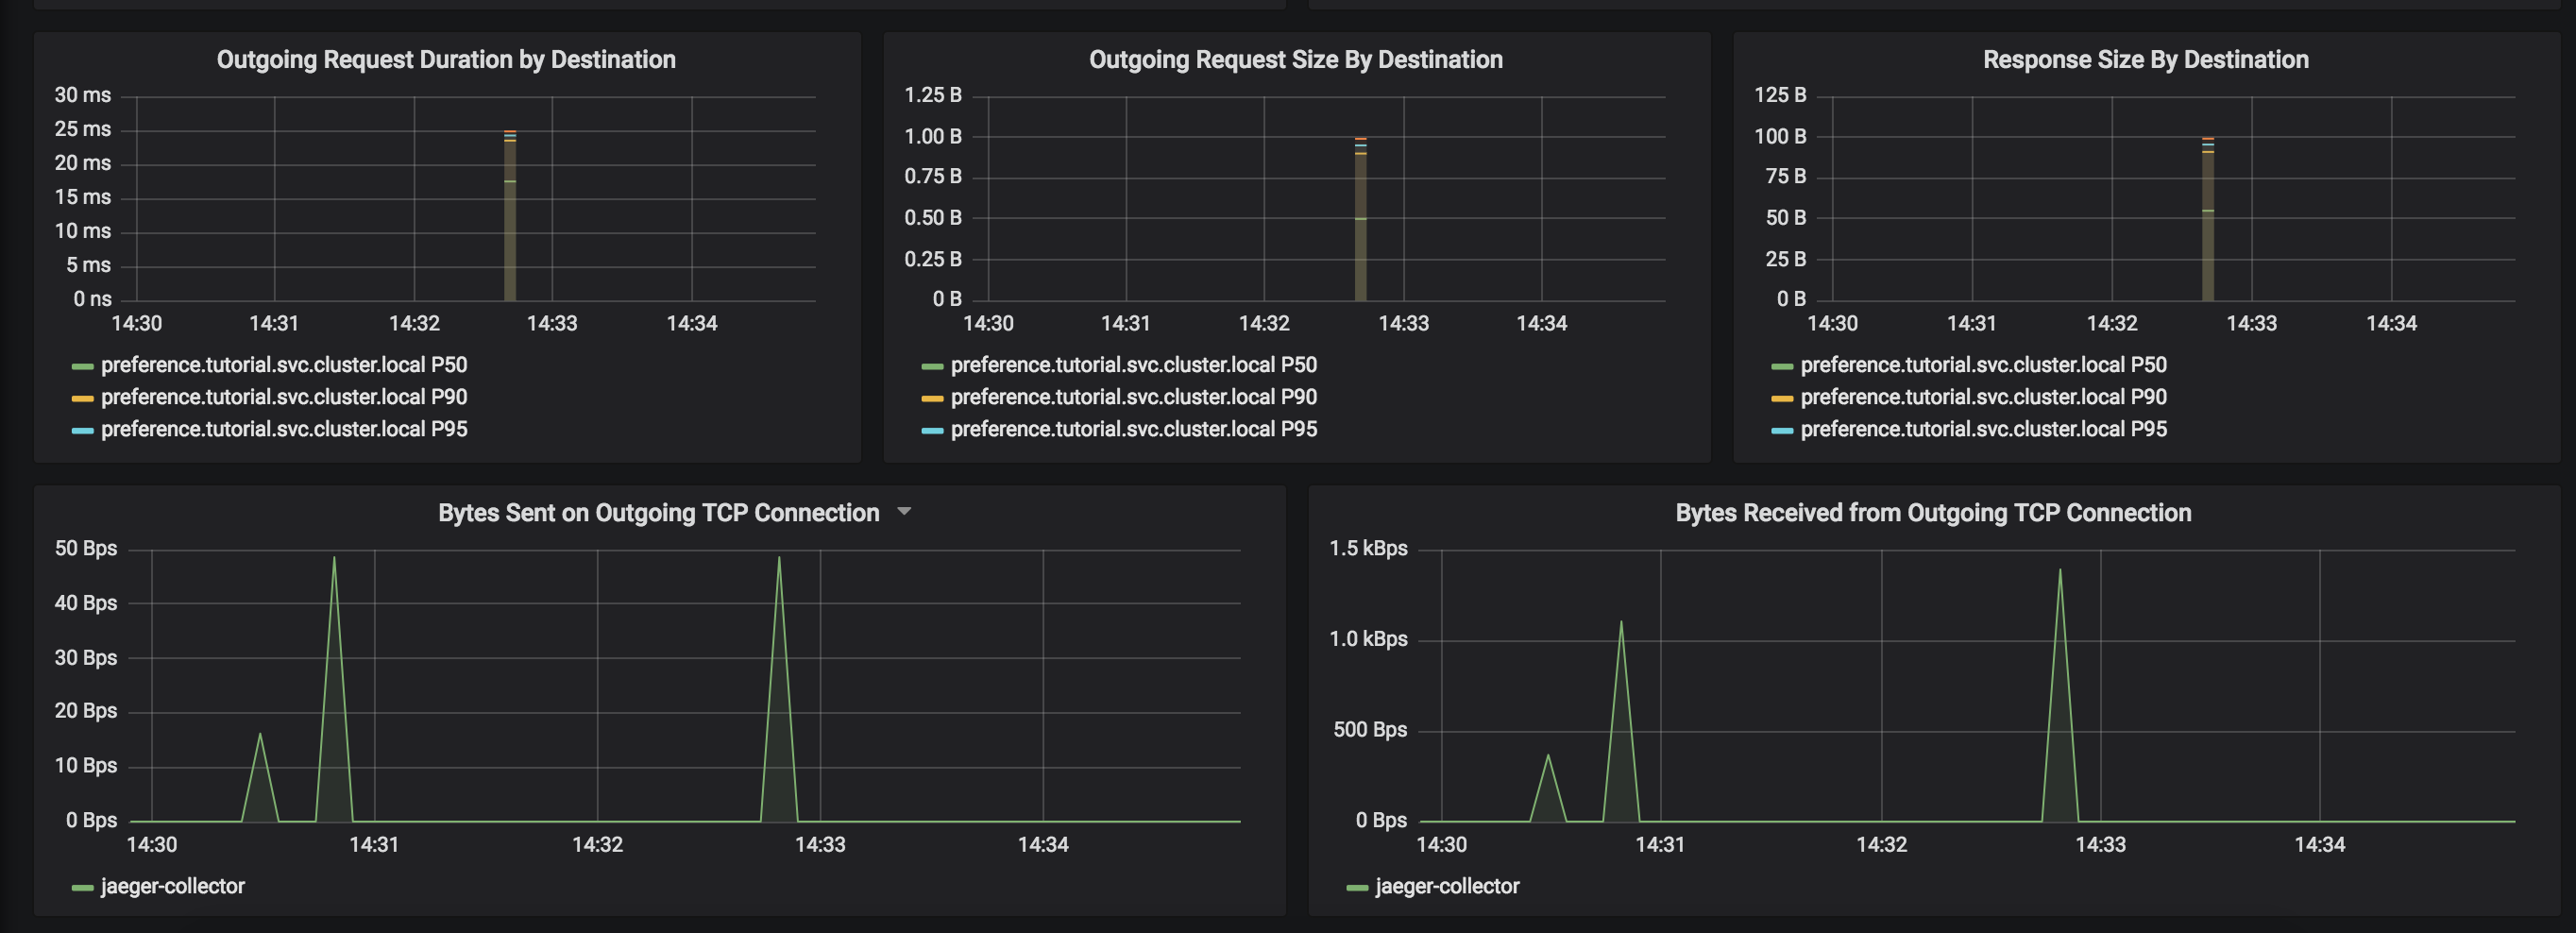
From the Grafana dashboard’s left hand corner navigation menu, you can navigate to Istio Workload Dashboard or visit http://localhost:3000/dashboard/db/istio-workload-dashboard in your web browser.
The Istio Workload Dashboard will look similar to:
Prometheus
Explore Prometheus:
kubectl -n istio-system port-forward $(kubectl -n istio-system get pod -l app=prometheus -o jsonpath='{.items[0].metadata.name}') 9090:9090 &
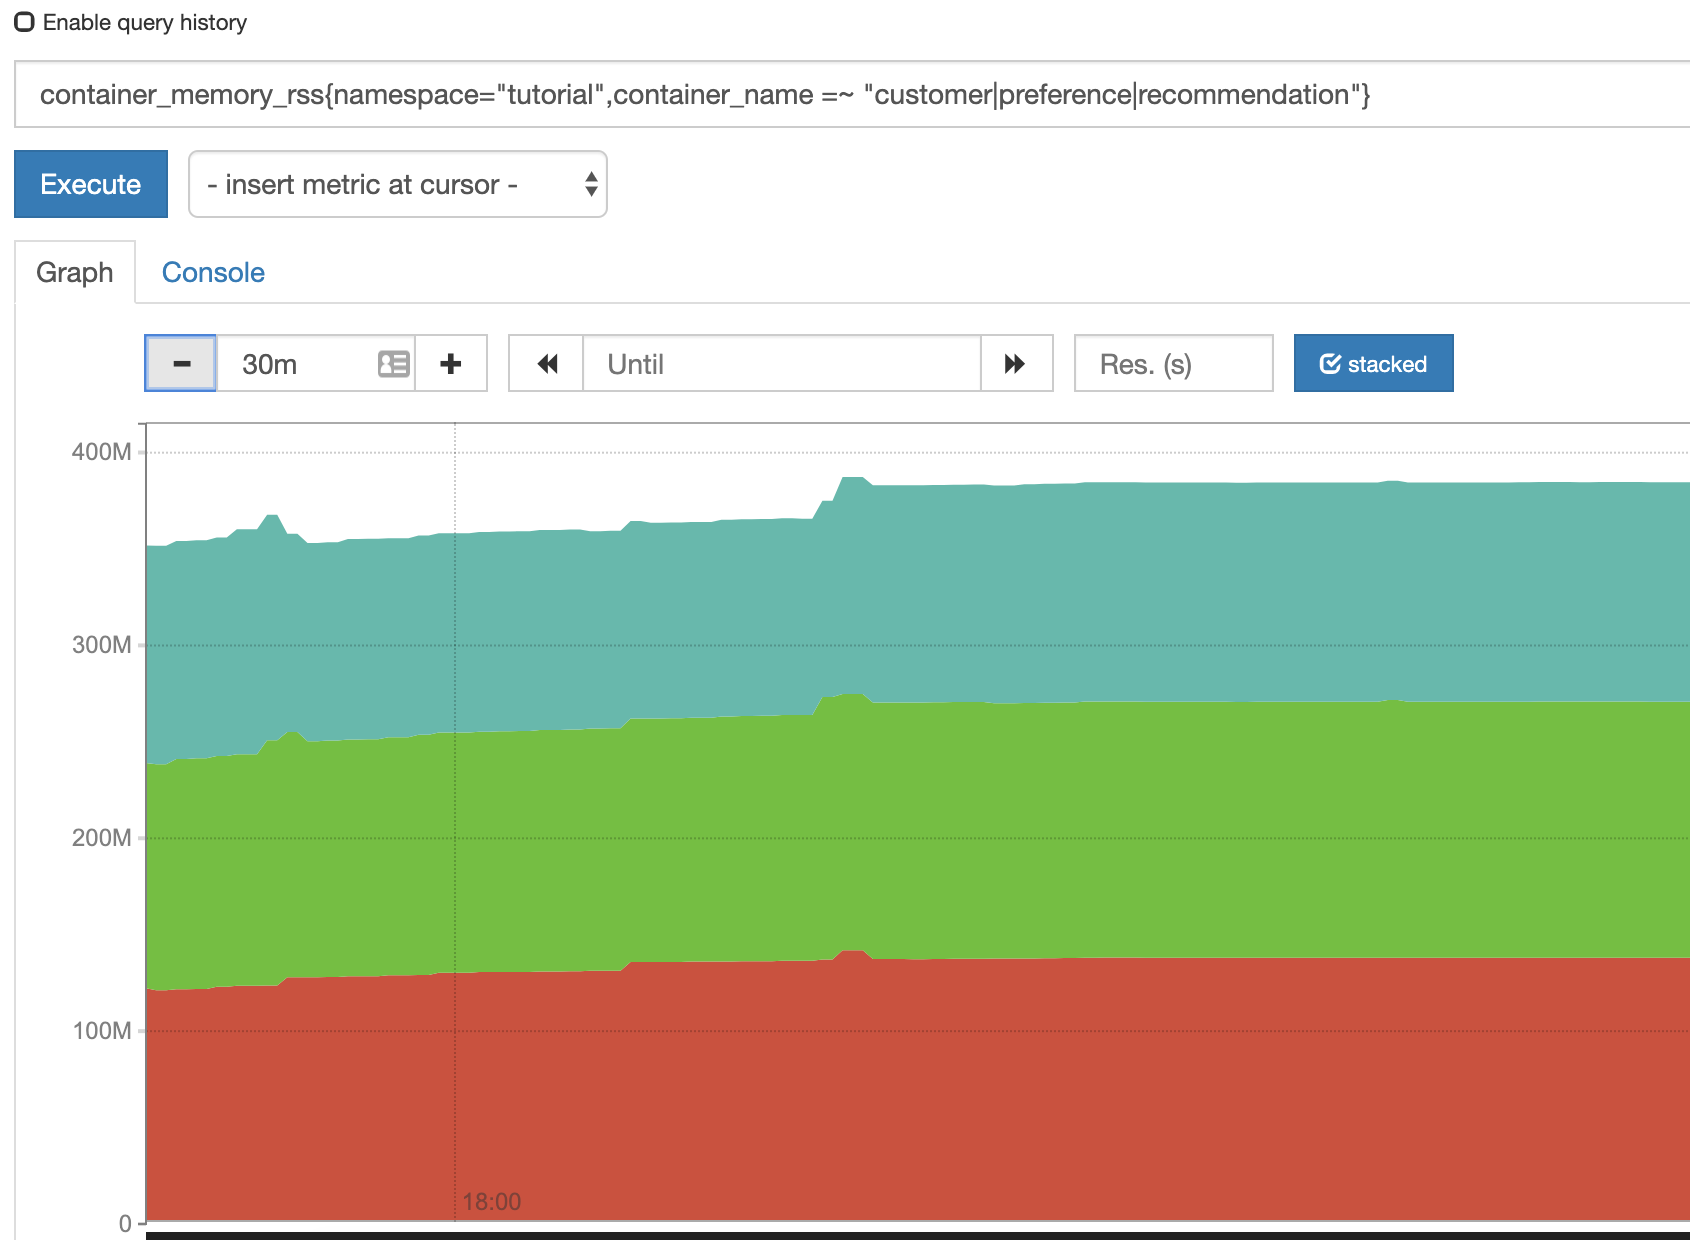
open "http://localhost:9090/graph?g0.range_input=15m&g0.stacked=1&g0.expr=&g0.tab=0"In the Prometheus dashboard, add the following
istio_requests_total{destination_app="customer"}and select Execute
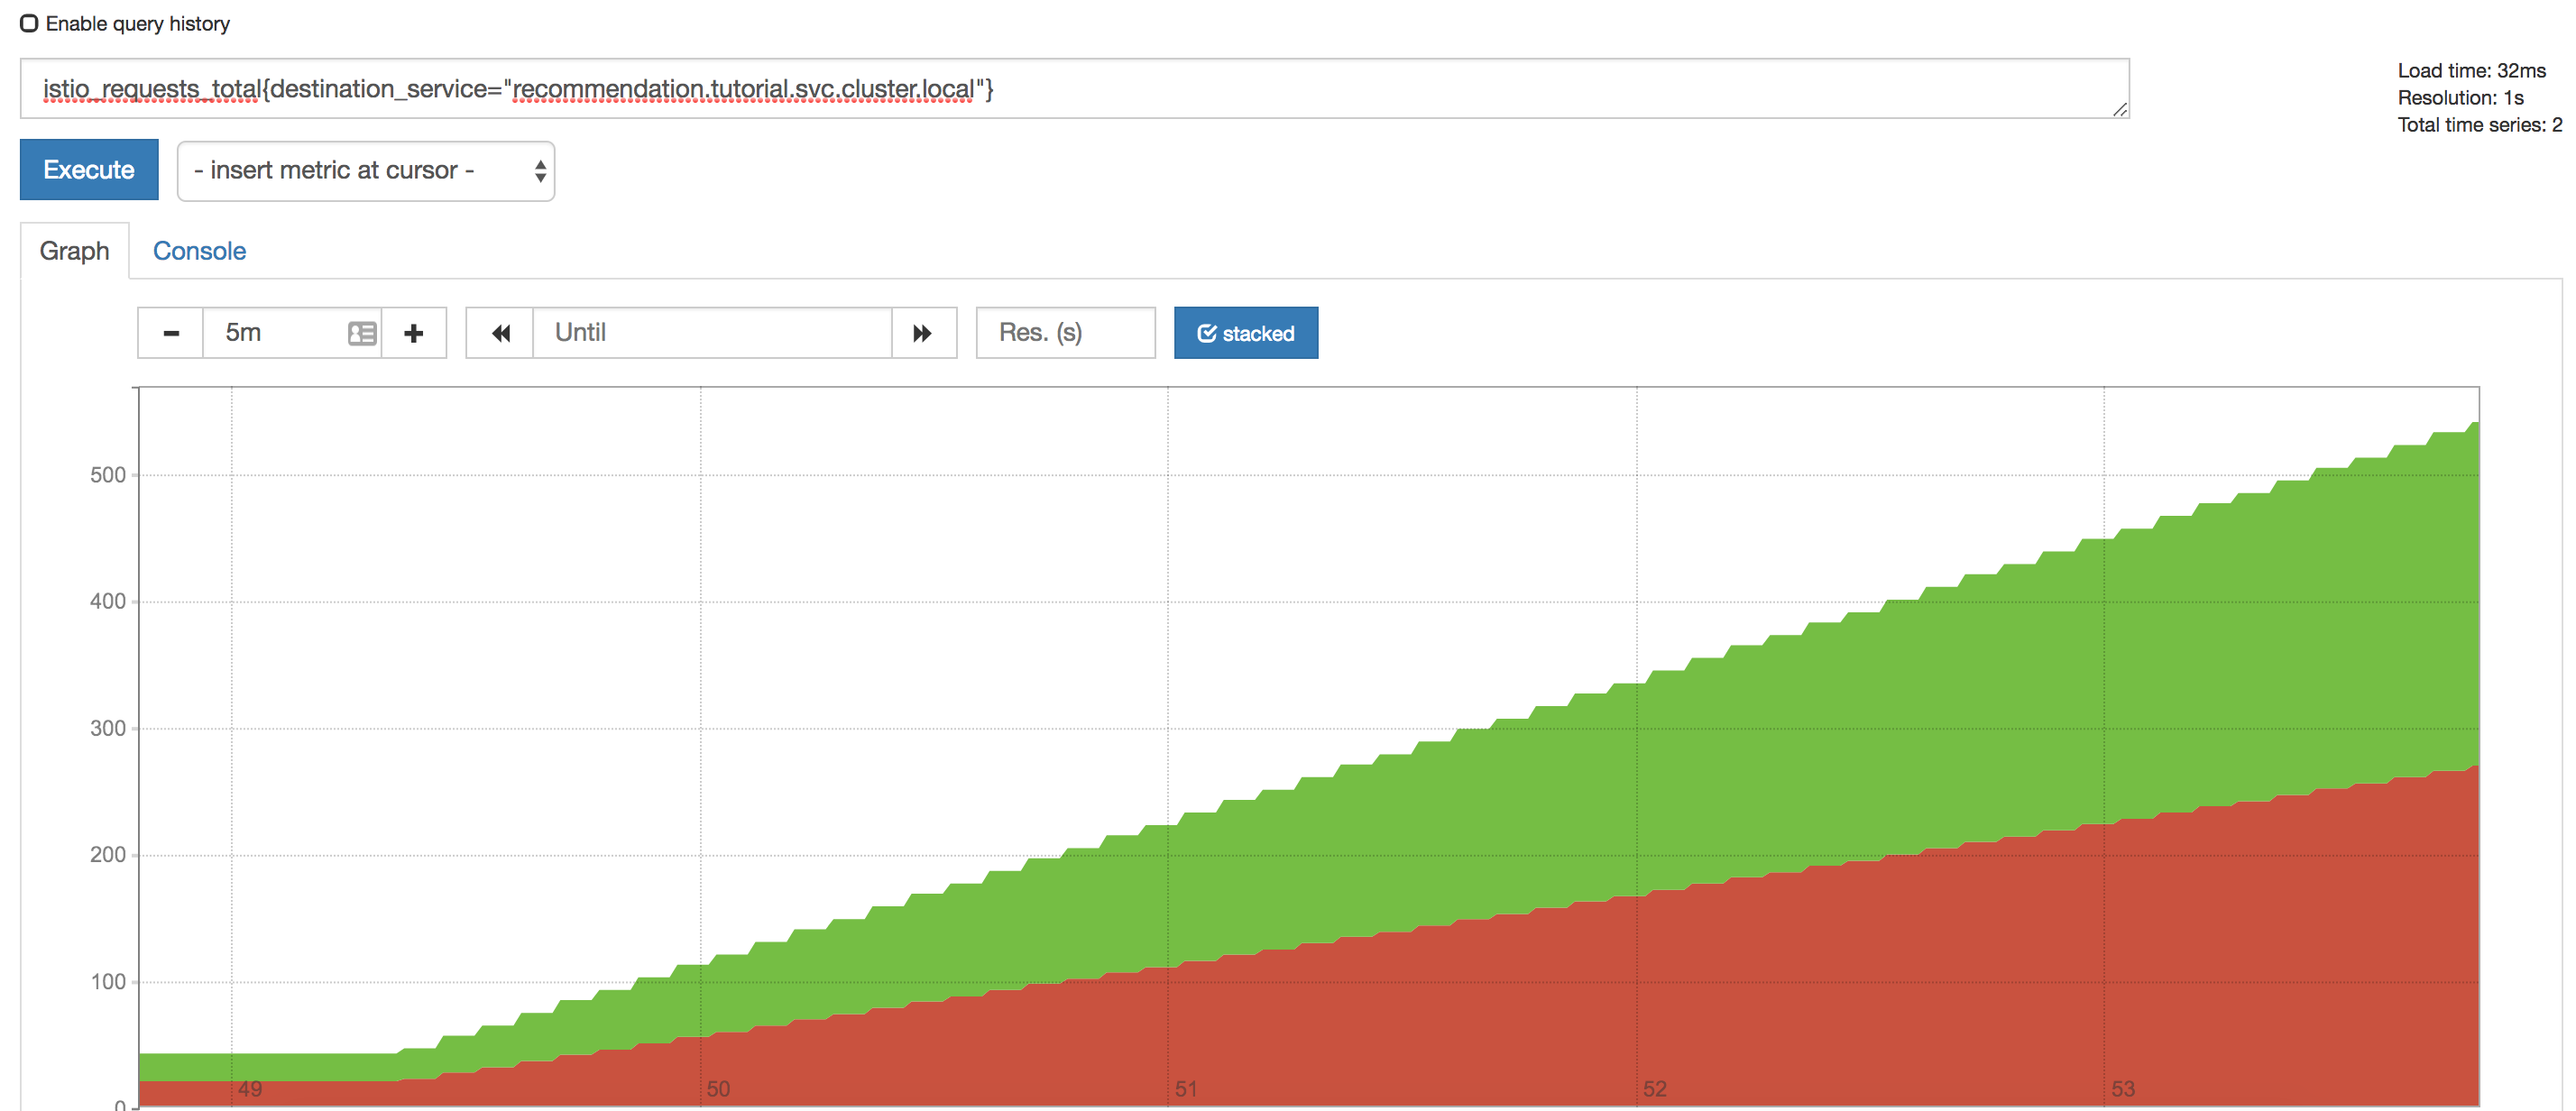
| You may have to refresh the browser for the Prometheus graph to update. And you may wish to make the interval 5m (5 minutes) as seen in the screenshot above. |
Tracing
Distributed Tracing involves propagating the tracing context from service to service, usually done by sending certain incoming HTTP headers downstream to outbound requests. For services embedding a OpenTracing framework instrumentations such as opentracing-spring-cloud, this might be transparent. For services that are not embedding OpenTracing libraries, this context propagation needs to be done manually.
As OpenTracing is "just" an instrumentation library, a concrete tracer is required in order to actually capture the tracing data and report it to a remote server. Our customer and preference services ship with Jaeger as the concrete tracer. the Istio platform automatically sends collected tracing data to Jaeger, so that we are able to see a trace involving all three services, even if our recommendation service is not aware of OpenTracing or Jaeger at all.
Our customer and preference services are using the TracerResolver facility from OpenTracing, so that the concrete tracer can be loaded automatically without our code having a hard dependency on Jaeger. Given that the Jaeger tracer can be configured via environment variables, we don’t need to do anything in order to get a properly configured Jaeger tracer ready and registered with OpenTracing. That said, there are cases where it’s appropriate to manually configure a tracer. Refer to the Jaeger documentation for more information on how to do that.
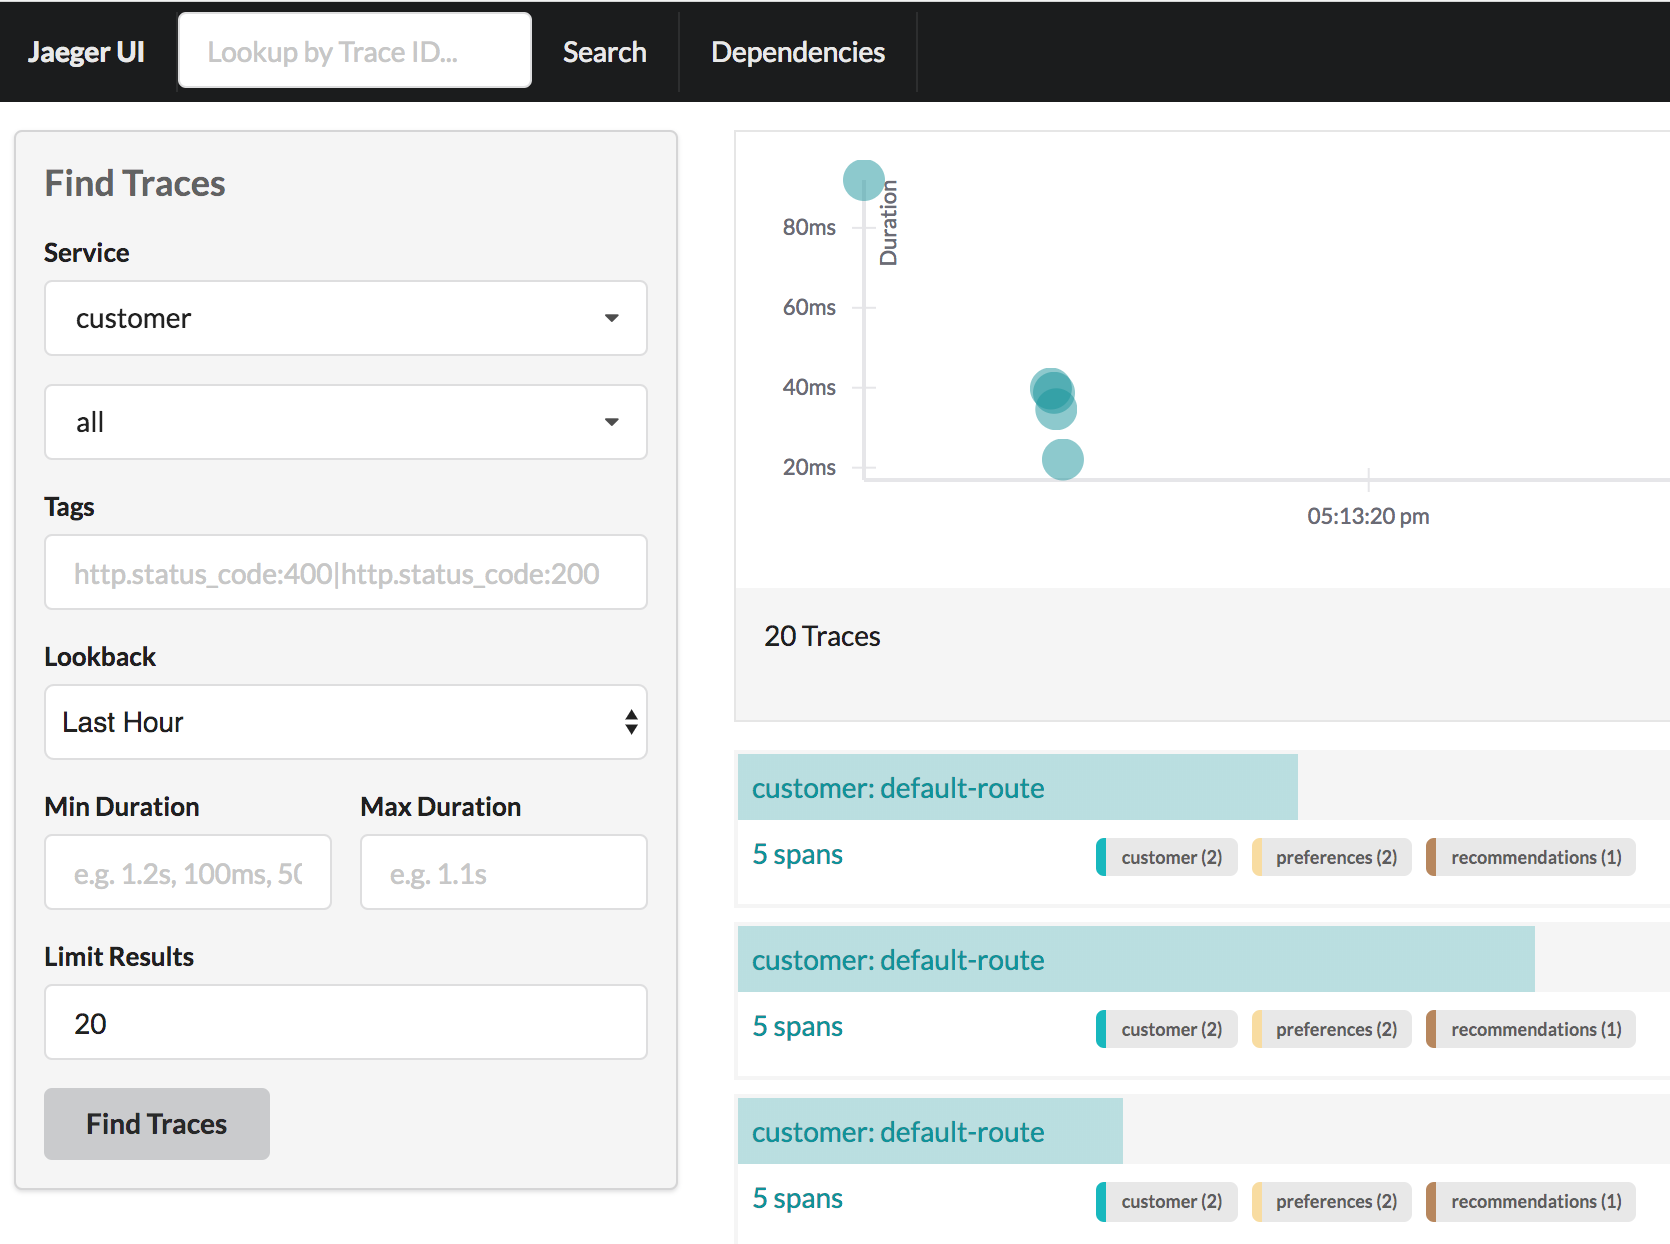
Let’s open the Jaeger console, select customer from the list of services and click Find Traces
kubectl -n istio-system port-forward $(kubectl -n istio-system get pod -l app=jaeger -o jsonpath='{.items[0].metadata.name}') 15032:16686 &

open http://localhost:15032/jaeger/search